In reality I notice that not every person within a client team has or takes the time to look into the data that Sitecore is sending to Application Insights on a daily and structured base. In essence not every person has to do that but should be served an overview on regular base. To improve the awareness of the power of logs we build an AI flow that queries Application Insights and sends reports using Sendgrid on a weekly base. In this post I will tell the steps to take so that you can build a report suiting your needs as well.
Prerequisites:
- Sendgrid account (free will do)
- Azure storage account (file share)
- Microsoft Flow account
- API Access Application Insights (Application ID and Key)
Lets begin:
Create a new Flow (from blank) and add your first task ‘recurrence’.
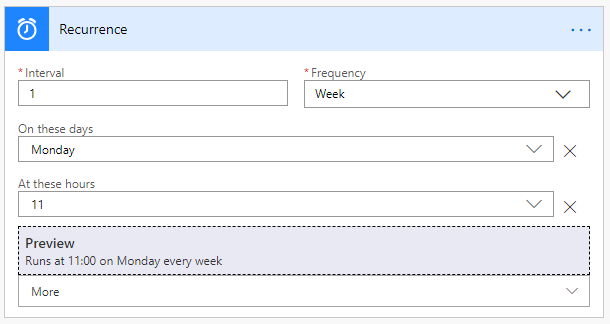
Monday 11:00 - “when most people start to awake”
Now add your second task, search for ‘Application Insights’ and select the ‘Visualize Analytics query’. You are most likely asked to add your Connector details to AI here. Add them by using the application id and corresponding key.
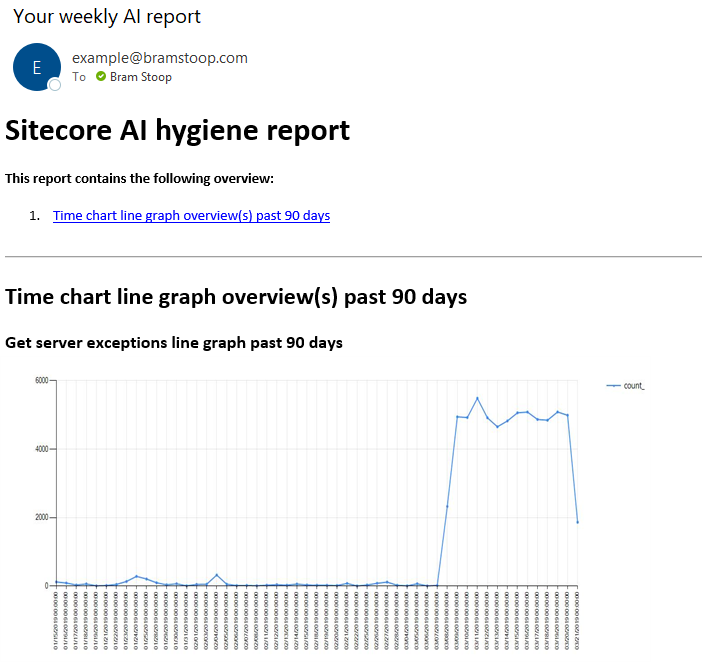
We are going to request a ‘Time Chart’ in this example, use the following query:
// Get server exceptions line graph past 90 days
exceptions
| where timestamp > ago(90d)
| where client_Type != “Browser”
| summarize count() by bin(timestamp, 1d)
Select ‘Time Chart’ as Chart Type.
Time Range - Set in query.
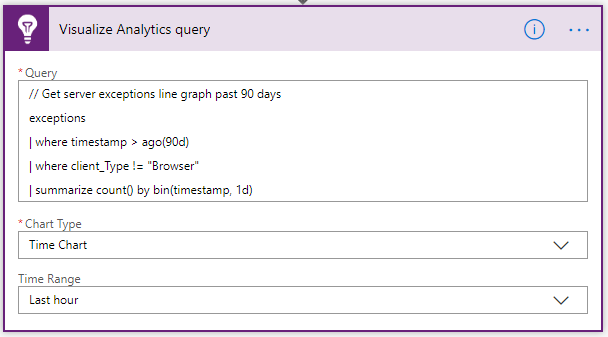
Visual of the AI action
The next step will be to create a file in an Azure file share based on the output of the AI task.
The main reason for this is that sending multiple attachments (not this example) is way easier by using hrefs in the body of your email.
Add action, search for “create file azure file storage”. Add a connection to your storage account and the file share within. Define your folder path.
The File name will be the ‘Attachment Name’ of your previous AI action.
The File content will be the ‘Attachment Content’ of your previous AI action.
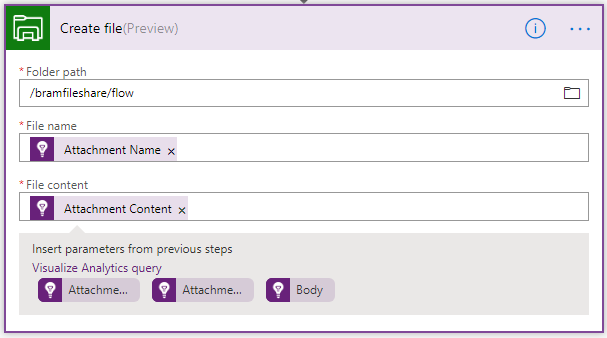
Visual of the file creation task
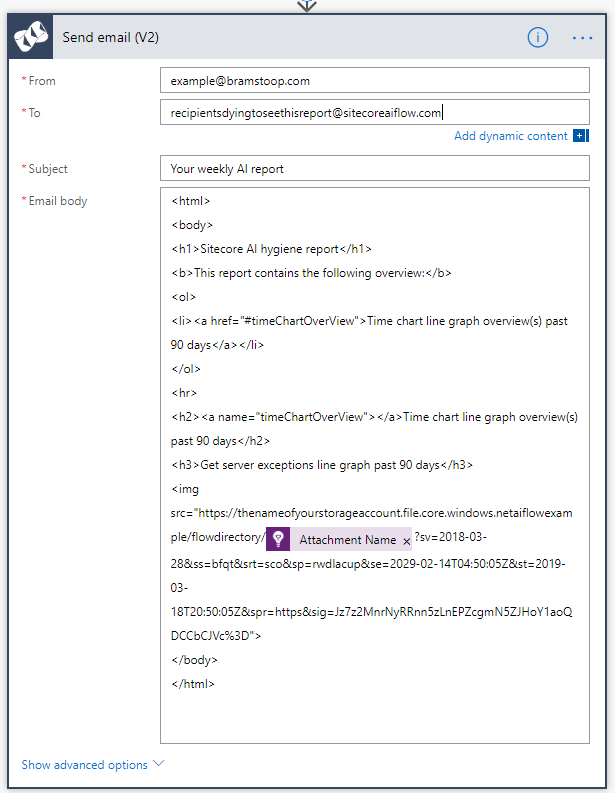
Now that we have uploaded the ‘Time Chart’ to our storage account we would like to present this image within an email to the team.
Add action and search for “sendgrid v2”. Fill in the From, To and Subject field.
And make sure that you are embedding the correct image (attachmentname) within the link to your file share.
It should look similar like:
Now save your flow, and perform a test run. You will receive an email containing:
Obviously the report above is just an example. Just as the whole instructions on building the report. I would suggest to work with dynamically generated sas tokens, variables and way more queries.. as you might require. On of our current flows looks like below:
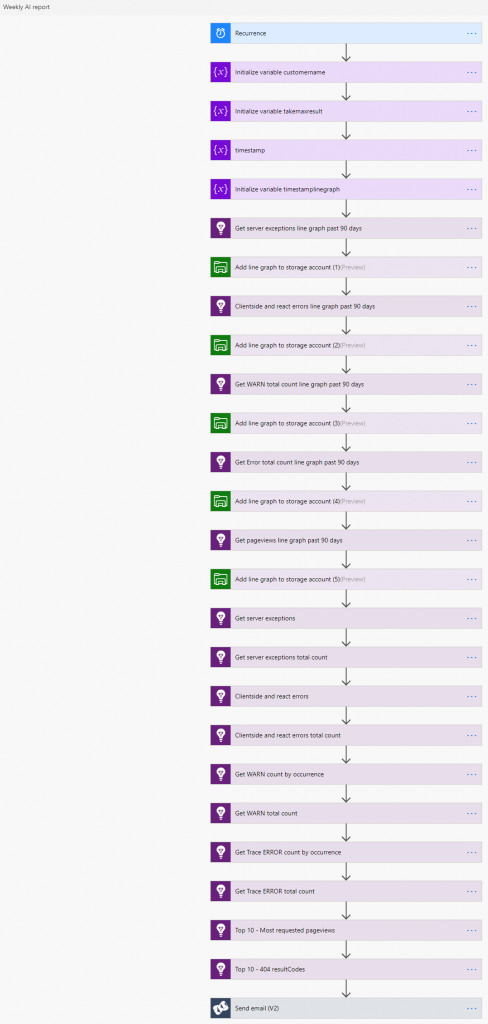
By looking at the reports on a regular base you will make teams aware of what has happened/is happening underneath the Sitecore ‘hood’ and on what code/performance improvements to focus during next sprints.
Hope you enjoyed the read.